College Cost: In-State Tuition’s Low, But What Will Grads Be Paid?
While the Department of Education works through the summer to have the President’s college rating system ready by early fall, many rising high school juniors and seniors (and their parents) are touring colleges and poring over the Department’s College Navigator and College Scorecard to see how the schools that have made their short lists stack up against one another and national averages.
Both are chock-full of information, but both gloss over something that most of us already recognize: For the millions of students who attend public, four-year colleges in their home states (where in-state tuitions are low), and work in those states after graduation, what’s affordable depends in large part on what graduates can expect to earn in those states. For example, a $15,000-a year net college price will be less burdensome to workers in a state with a median income of $60,000 than to those with a median income of $40,000. Two numbers can give a clearer picture of college affordability:
- Net price (college tuition and other costs minus any grant aid)
- Net price as a percentage of median income in their college’s state
Net Price: The map below shows state-by-state net prices at public four year colleges. The lighter the shade of blue, the lower the net price of public colleges—for full-time, first-time, degree/certificate-seeking undergraduates. (Alaska is in the second group; Hawaii is in the fourth.)
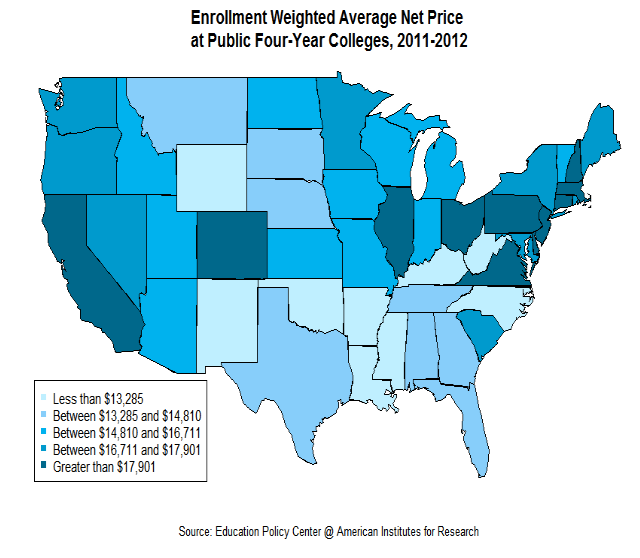
The net price of public four-year colleges tends to be higher on the coasts, and is highest in the Northeast and West Coast. Net price is lowest in the South.
So public colleges in the South overall are more affordable, right? Maybe not. Especially if graduates get jobs in the South.
Median Income: The second part of the college affordability story is how burdensome any given net price is after a student graduates and starts working. To explore how accounting for income changes the college affordability picture, the figure below displays each state’s net price as a percent of its median income. The lighter the shade of blue, the lower net price of four-year public colleges is as a percent of median income. (Alaska and Hawaii are not shown, and are in the first and second groupings, respectively.)
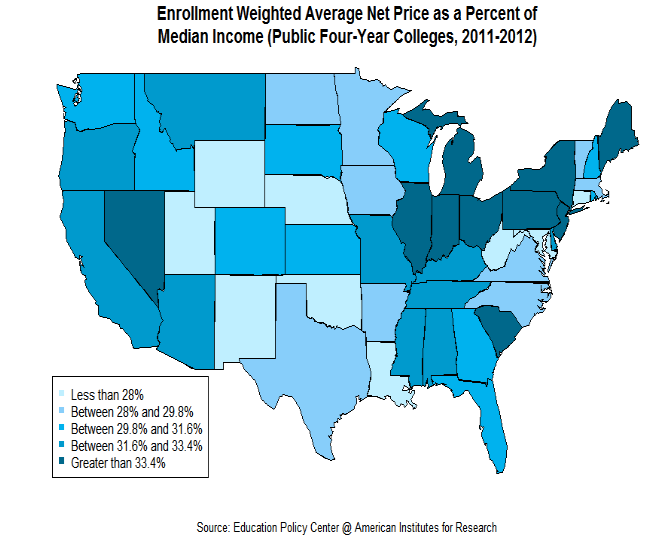
Accounting for the median income in a state yields some dramatic turnabouts in college affordability. Some states with low net prices also have low median incomes, resulting in less affordable colleges than net price alone shows. Kentucky and Mississippi, for instance, go from being among the most affordable states in net price to being relatively expensive.
Similarly, some high net price states are more affordable than they first appeared thanks to high median incomes. Connecticut moved from the most expensive category to the most affordable one.
There were also changes in the overall pattern among geographic regions. The South no longer stands out as being the most affordable region; the non-coastal West does. The Great Lakes and parts of the Northeast also fare poorly, with a high concentration of low affordability states.
A road trip from New York City to Chicago (with stops in Newark, Pittsburgh, Columbus, Detroit, and Indianapolis) would weave through most of the country’s most unaffordable public four-year college states.
These differences in college affordability matter. Greater affordability helps ensure that many students will attend college in their home state. While some of these students will move to a different state after graduating, many will remain in-state. Ensuring that college is affordable for these students should be high on the list of policy priorities of these states, particularly states that have high net prices and low median incomes.
Matt Soldner is a senior researcher at AIR.